


Approximately half of Britain's 30 million residential properties saw their worth climb during 2025, fresh analysis from Zoopla reveals.
The property portal estimates that 15.2 million homes recorded gains of at least one per cent, translating to an average uplift of £9,900 per property.
Official figures from the Office for National Statistics paint a similar picture, with the typical UK home reaching £271,000 following a 2.5 per cent annual increase to November 2025.
However, the market told very different stories depending on location. Clear geographical divisions emerged throughout the year, with northern England, Scotland and Northern Ireland seeing robust growth, while southern regions continued to struggle with persistent affordability pressures.
Around 3.1 million homeowners saw their property values rise by more than £20,000, while 9.1 million homes lost at least one per cent of their value.
The strongest performance was concentrated in northern parts of the UK. More than seven in ten homeowners across northern England, Scotland and Northern Ireland recorded price increases over the year.
Northern Ireland led the way, with an estimated 94 per cent of properties rising in value and typical gains of £14,200. Scotland followed, where 73 per cent of homes increased by an average of £10,400.
The North West also performed strongly, with 72 per cent of properties gaining value and average rises of £9,700. At a local level, Renfrewshire stood out as the top-performing authority, with 95 per cent of homes increasing in value.
Elsewhere, more than 60 per cent of properties rose in both the North East and Wales. Other hotspots included Wrexham, where 79 per cent of homes gained value, and Northumberland at 78 per cent.
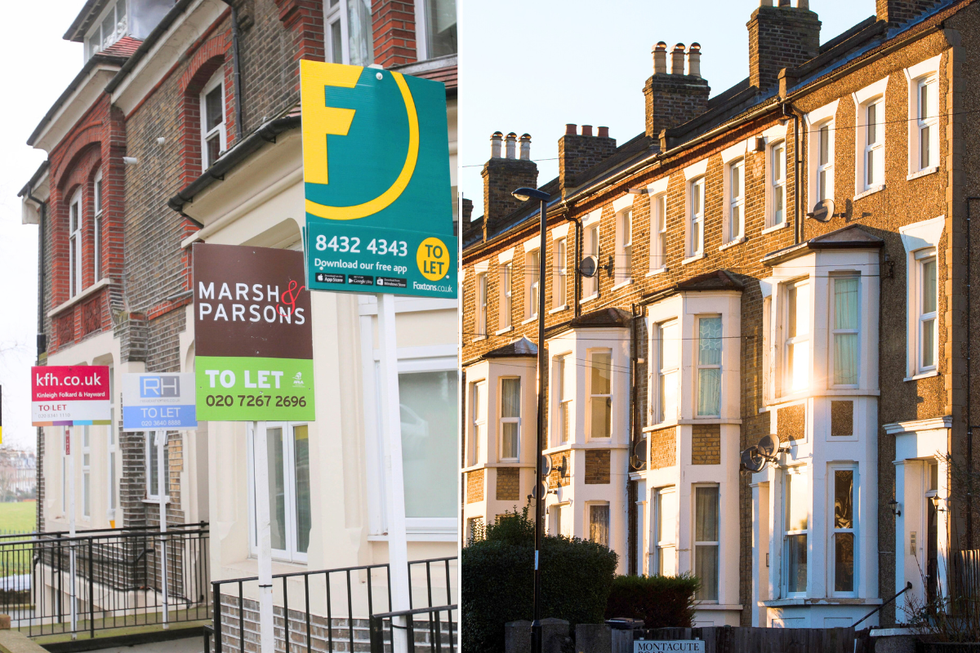
Southern England presented a markedly different picture, bearing the brunt of market weakness throughout 2025. Six in ten properties that lost value over the year were in southern England, where higher prices and greater buyer choice continued to weigh on affordability.
More than 60 per cent of properties rose in both the North East and Wales
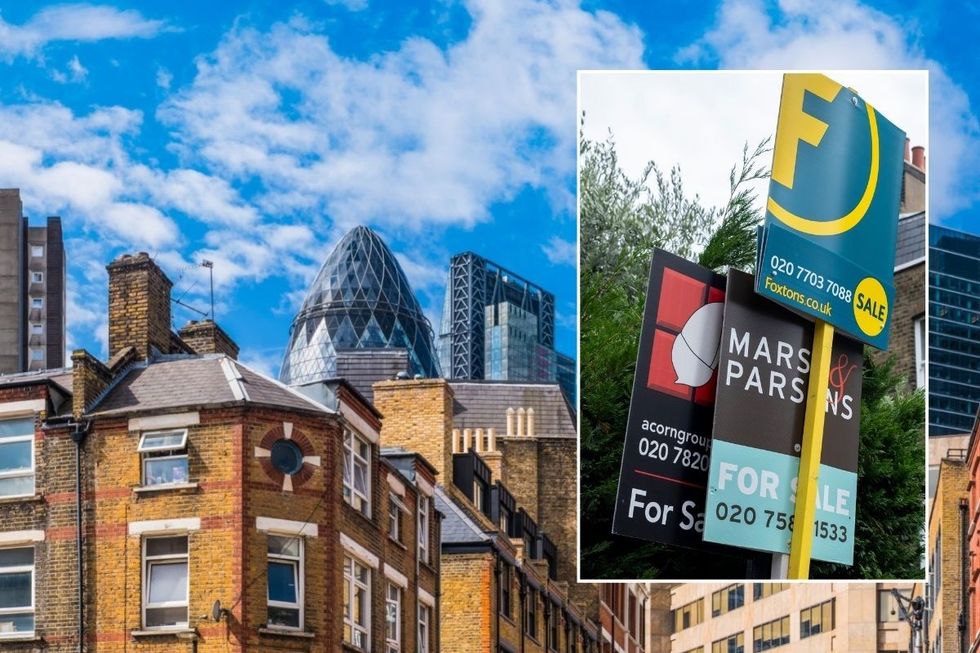
| GETTYLondon performed worst of all regions, with house prices falling by 1.2 per cent in the year to November, according to Office for National Statistics data. Just 35 per cent of homes in the capital recorded price rises, although those that did gained an average of £17,400.
The South East and South West showed similarly weak performance. Only 32 per cent of properties in the South East and 33 per cent in the South West saw values increase over the year
By contrast, the North East recorded the strongest house price growth of any English region, with prices rising by 6.8 per cent, highlighting the growing divide between northern and southern housing markets.
Property type also played a role. Terraced and semi-detached homes proved the most resilient, with 56 per cent seeing steady value increases over the year.

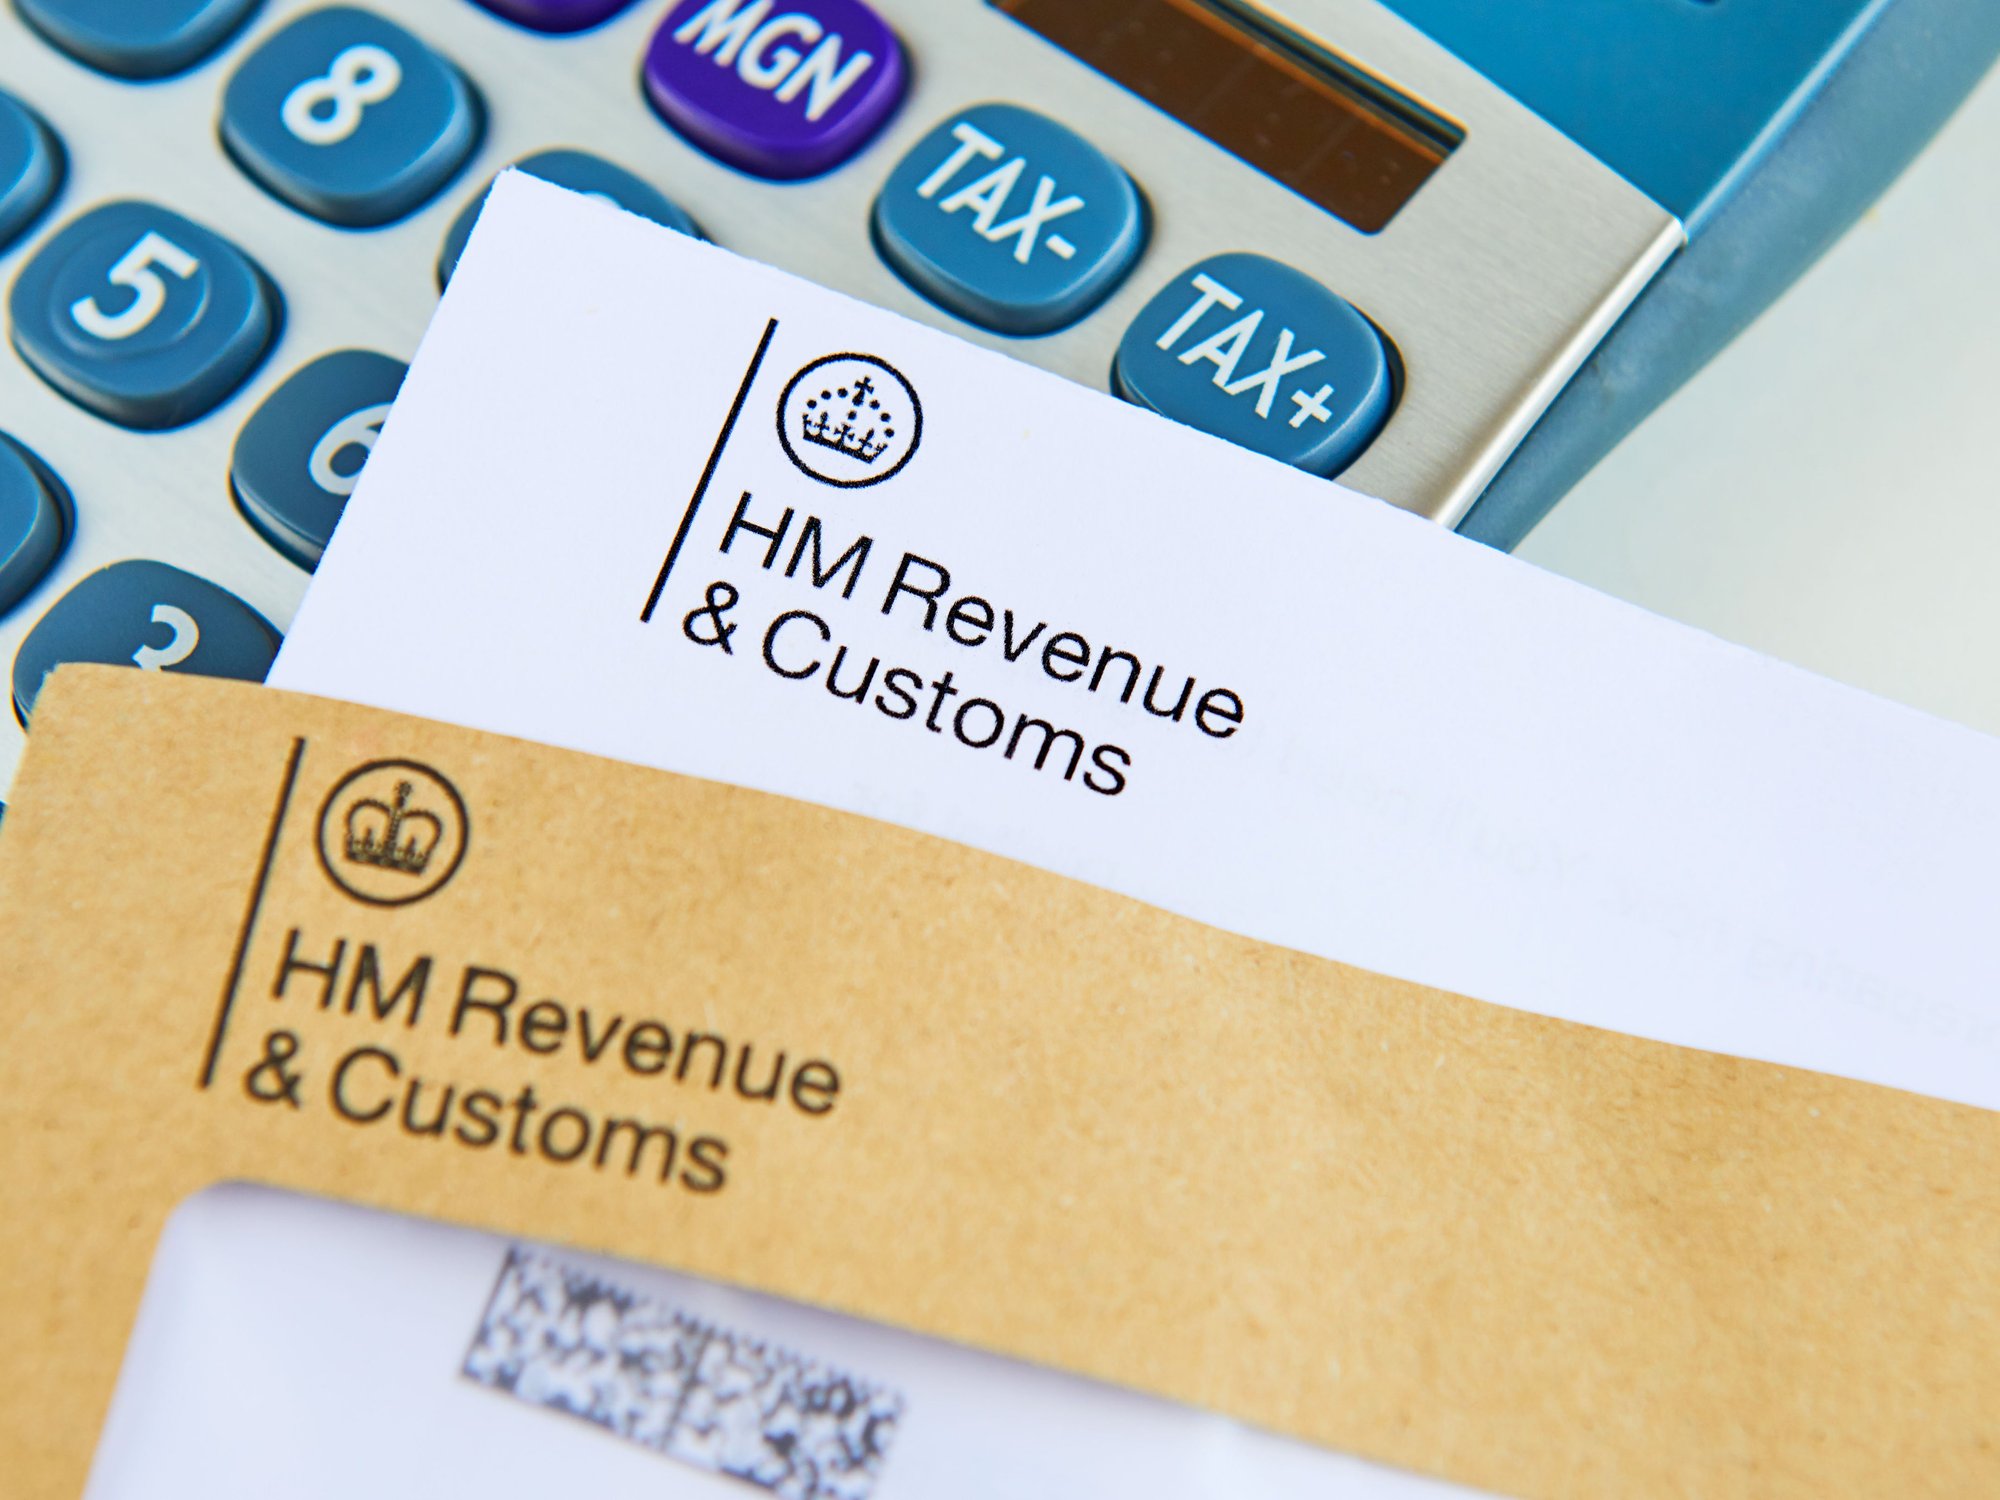
Property prices have continued climbing while tax-free thresholds remain static
| GETTYFlats struggled the most, with half losing at least one per cent of their value during 2025.
Richard Donnell, executive director at Zoopla, said: "The general trend is that most home values continue to increase steadily upwards, especially away from southern England. However, many homes are registering broadly static or lower values as the market continues to adjust to higher mortgage rates and more homes for sale which is boosting choice for buyers."
Aneisha Beveridge, head of research at Hamptons, noted that more affordable areas in the Midlands and North have outperformed for most of the past decade.
She said: "By contrast, households in London and the South have felt the impact of higher interest rates most acutely since 2022, which has held back price growth, narrowing the historic North-South divide."
London performed worst of all regions, with house prices falling by 1.2 per cent in the year to November, according to Office for National Statistics data
| PAPercentage of homes that rose in value in 2025 and average cash gain (Zoopla)
- Northern Ireland – 94 per cent, £14,200
- Scotland – 73 per cent, £10,400
- North West – 72 per cent, £9,700
- North East – 67 per cent, £6,600
- Wales – 60 per cent, £8,000
- Yorkshire and the Humber – 58 per cent, £7,800
- West Midlands – 55 per cent, £8,600
- East Midlands – 43 per cent, £7,400
- East of England – 41 per cent, £11,000
- London – 35 per cent, £17,400
- South West – 33 per cent, £10,400
- South East – 32 per cent, £11,800
Top property value hotspots by region in 2025 (Zoopla)
(Northern Ireland excluded)
- Scotland – Renfrewshire: 95 per cent, £12,500
- North West – Chorley: 88 per cent, £11,500
- Wales – Wrexham: 79 per cent, £10,400
- North East – Northumberland: 78 per cent, £8,600
- Yorkshire and the Humber – Calderdale: 77 per cent, £10,000
- West Midlands – Dudley: 77 per cent, £8,500
- East of England – Castle Point: 67 per cent, £10,500
- East Midlands – High Peak: 67 per cent, £8,800
- South West – Gloucester: 62 per cent, £8,300
- London – Waltham Forest: 59 per cent, £26,600
- South East – Test Valley: 58 per cent, £12,300
More From GB News