


Britain’s lowest-paid workers are now closer to the middle of the income ladder than they were even at the height of Soviet wage controls. But the comparison only captures part of the inequality picture.
The UK’s minimum wage stands at around 66 per cent of average earnings, above the Soviet Union’s peak of roughly 60 per cent, analysis suggests.
This indicates the gap between low-paid workers and those on average incomes is narrower in Britain today than it was under communist rule.
However, economists caution that this measure focuses only on the distance between the bottom and the middle of the pay scale.
Overall inequality is typically judged by the full spread of earnings, particularly the gap between those at the bottom and top earners.
In the UK today, someone earning more than 90 per cent of workers makes about three times as much as someone in the bottom 10 per cent.
Historical estimates based on Soviet-era data and later economic analysis suggest the gap between high and low earners in the USSR rarely fell below around 2.7 times.
For most of its history it ranged between 3.2 and 4.4 times. Even at its most equal point in 1968, the gap was 2.7 — only slightly smaller than the UK’s current level of around three times.
Dr Kristian Niemietz, the IEA's Editorial Director and Head of Political Economy, cautions that a compressed wage structure is not automatically positive or negative.
"In terms of nominal wage gaps, the UK is more equal than communist Russia. But we have to bare in mind flat wage distribution isn't good or bad in itself, what matters is what's causing it," he told GB News.
The economist explained that if productivity gains in lower-paid sectors drove greater equality, that would be welcome news. However, he argues this is not what has occurred in Britain.
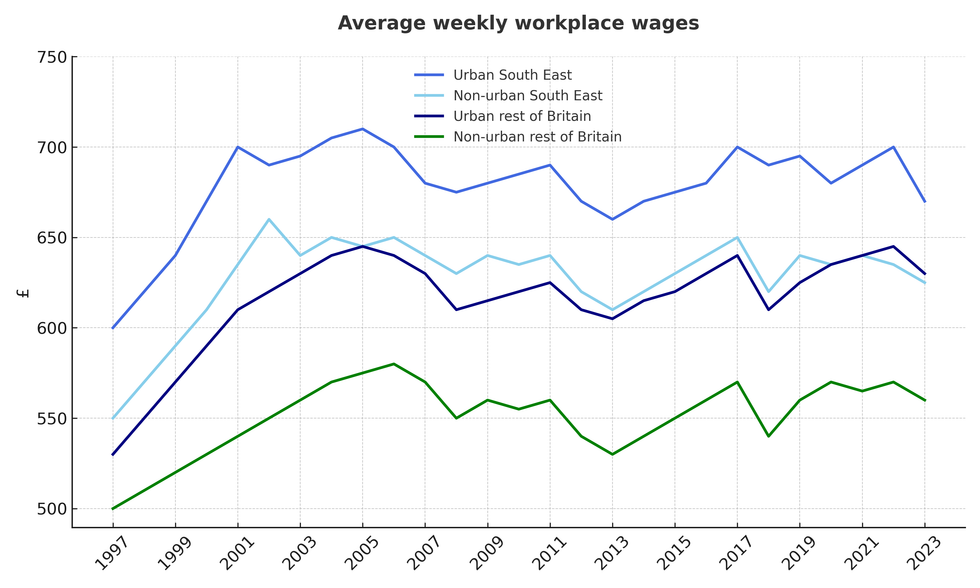 UK wages have flat-lined since 2008 | CHAT GPT
Instead, Government policy has pushed up the minimum wage significantly, from below half of average earnings when introduced in the late 1990s to approximately two-thirds today.
The figures paint a stark picture when examining actual take-home pay.
A full-time worker on the minimum wage, putting in 40 hours weekly, receives £22,555 after tax.
By contrast, someone earning £100,000 annually, placing them in the top five per cent of earners, takes home £68,558.
 The number of unemployed people per job vacancy is at a new post-pandemic high | GB NEWS
This produces a net income ratio of roughly 3:1 between a top earner and someone on the lowest legal wage.
During the Soviet era, this same comparison never dropped below 5:1, meaning high earners in the USSR kept proportionally more of their wages relative to the lowest paid.
The gap narrows further still when student loan repayments are factored in for higher earners.
Dr Niemietz warns that this wage compression is driving up joblessness among young people.

Workers earning just above the minimum wage must receive premium pay to maintain some distance from the floor, c
| GETTY"For the past 30 years, youth unemployment has been much lower than the EU average. Now it's about the same," he said.
Britain has traditionally benefited from a flexible labour market that generated employment even during economic downturns.
"Even in economically bad times, the labour market would always churn out jobs, no matter what and that advantage has now been lost because of the minimum wage and many other changes to labour market legislation," the economist said.
Workers earning just above the minimum wage must receive premium pay to maintain some distance from the floor, creating a ripple effect throughout the wage structure.