REVEALED: Civil Service in pay rise bonanza with 290 staff earning more than £150k
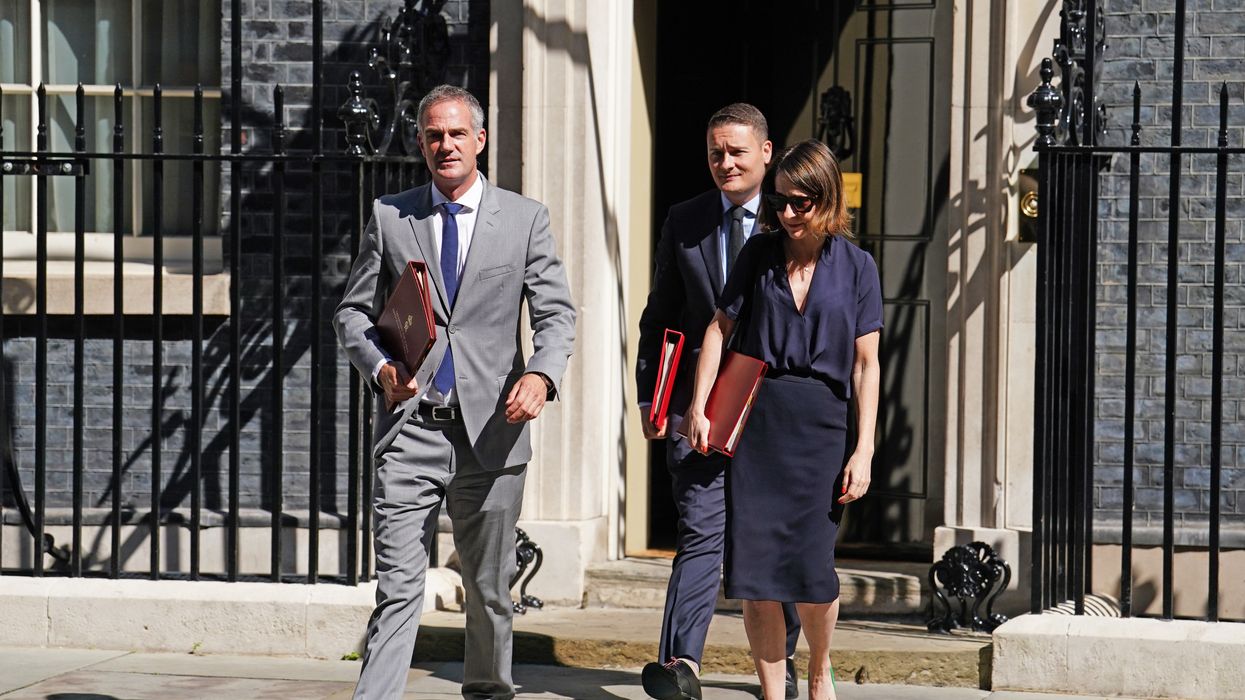
Science, Innovation and Technology Secretary Peter Kyle, Health Secretary Wes Streeting and Work and Pensions Secretary Liz Kendall leaving Downing Street
|PA
The statistics were revealed in the Civil Service Report of Statistics for 2024
Don't Miss
Most Read
Latest
The UK Civil Service has seen a significant surge in its workforce with a 34 per cent increase in the last ten years accompanied by generous pay rises.
Striking statistics regarding the makeup of the Civil Service, including increases in pay and working patterns, have been revealed in a joint investigation by Facts4EU.Org and GB News.
In the latest Civil Service Statistics report, updated on August 20, the average full-time salary has increased 32 per cent in the last ten years, from £29,750 in 2014 to £39,240.
However, amongst the top earners, 2,915 staff are making over £100,000 p.a. while 260 are earning £150,000 to £200,000 p.a. and 30 are making over 200,000 p.a.
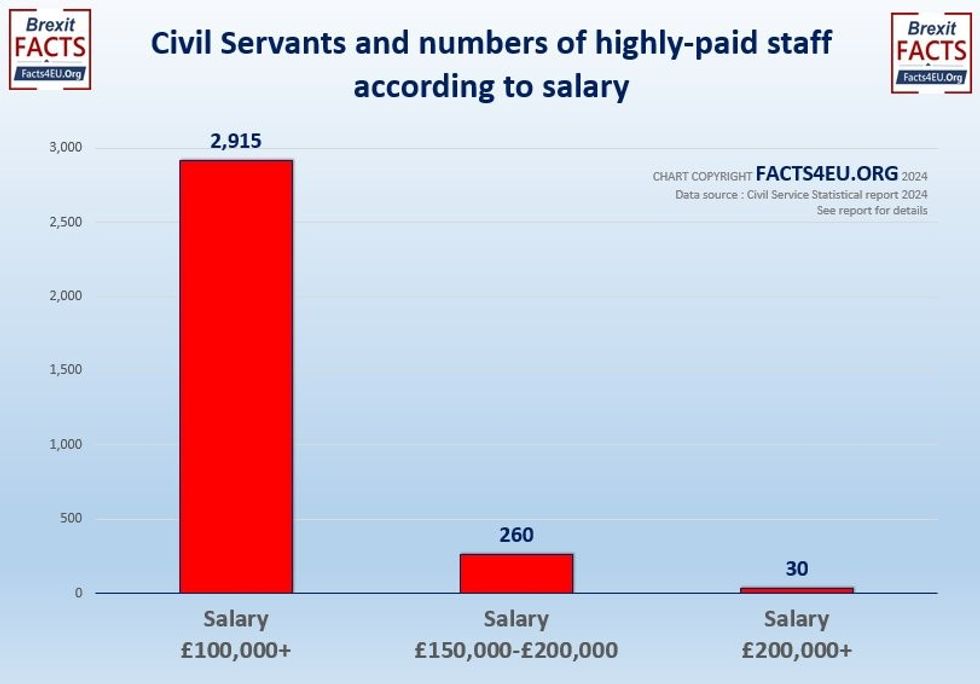
This graph shows civil servants and numbers of highly-paid staff according to salary
|Facts4EU.Org
The median salaries vary by grade, from £24,480 in the administrative grades to £88,970 at the Senior Civil Service level (SCS).
According to the Civil Service Report 2024, the proportion of full-time staff is growing each year and fewer civil servants are working part-time.
In 2014, there were 327, 854 full-time staff which has increased 33.9 per cent to 2024 where the figure stands at 438,965.
Around one in five (19.1%) of civil servants work part-time, which is down from a peak of one in four (25.5%) in 2015.
The percentage of civil servants working part-time is lower in senior grades, decreasing from 26.6 per cent of those in the Administrative Officer/ Administrative Assistant grades to 11.6 per cent at the top SCS level.
By sex, there are more women (296,075) than men (246,75) in the Civil Service, however, men outnumber women at G6/G7 and SCS levels.
The number of women in the civil service is also down slightly in 2023 from 54.6 per cent last year to 54.5 per cent in 2024.
The median and mean gender pay gap for the Civil Service is 8.5 per cent and 7.4 per cent, down from 9.6 per cent and 8.1 per cent in 2023 respectively.
But of those with a known ethnicity, the percentage who are from an ethnic minority is at a record high of 16.6 per cent, which is an increase from 15.4 per cent in 2023 and 10.2 per cent in 2014.
By headcount, Asian civil servants (39,395) make up the largest ethnic minority group in the Civil Service, followed by Black civil servants (19,810).
Representation of ethnic minority, disabled and LGBO civil servants, 2014 to 2024
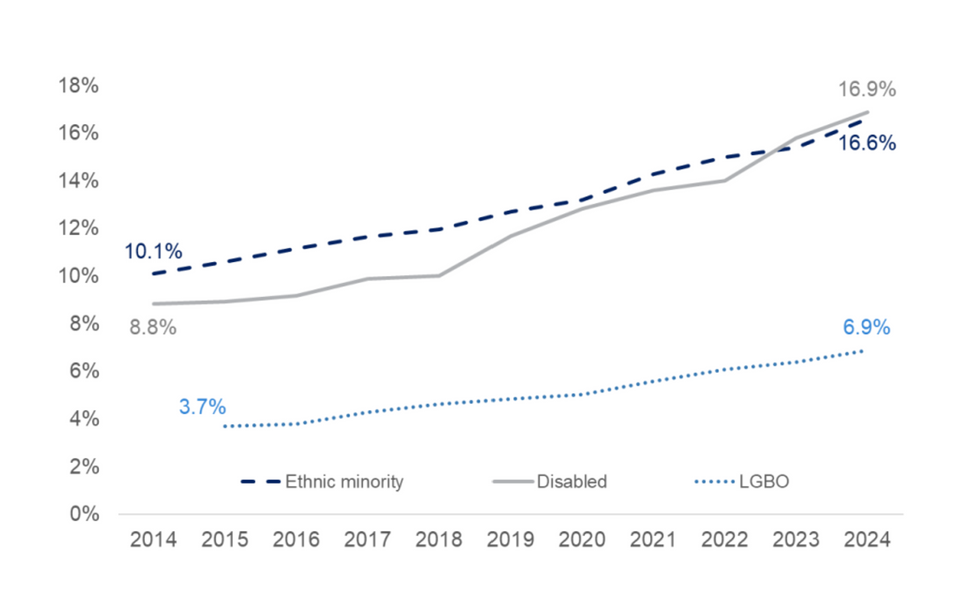
Graph of representation of ethnic minority, disabled and LGBO civil servants, 2014 to 2024
|Civil Service Statistics Report 2024
LATEST FROM MEMBERSHIP:
- Inside Reform UK’s plot to oust Labour as Starmer put on notice ahead of ‘tax raid’ Budget
- 'Britain needs a decent opposition. That's why the Tories must expose Reform's manifesto'
- Get FIVE free entries to the Great British Giveaway when you become a GBN member in September
Furthermore, since 2014 there have been year-on-year increases in the percentage of civil servants who declare themselves as disabled.
The figure stands at 16.9 per cent, another record-high, up from 15.8 per cent in 2023 and 8.9 per cent in 2014.
The largest increase has been at the Executive Officer level – this has more than doubled and is 19.2 per cent compared with 9.1 per cent in 2014.
Finally, of those with a known sexual orientation, 6.9 per cent of civil servants identify as being lesbian, gay, bisexual or ‘other’.
This has increased every year and now sits at 6.9 per cent, up from 3.7 per cent in 2015.
A Cabinet Office spokesperson said: "The average rise in full-time salaries aligns with inflation over the same period. Salaries in the public sector must always be justified and closely scrutinised to ensure they represent value to taxpayers."


